
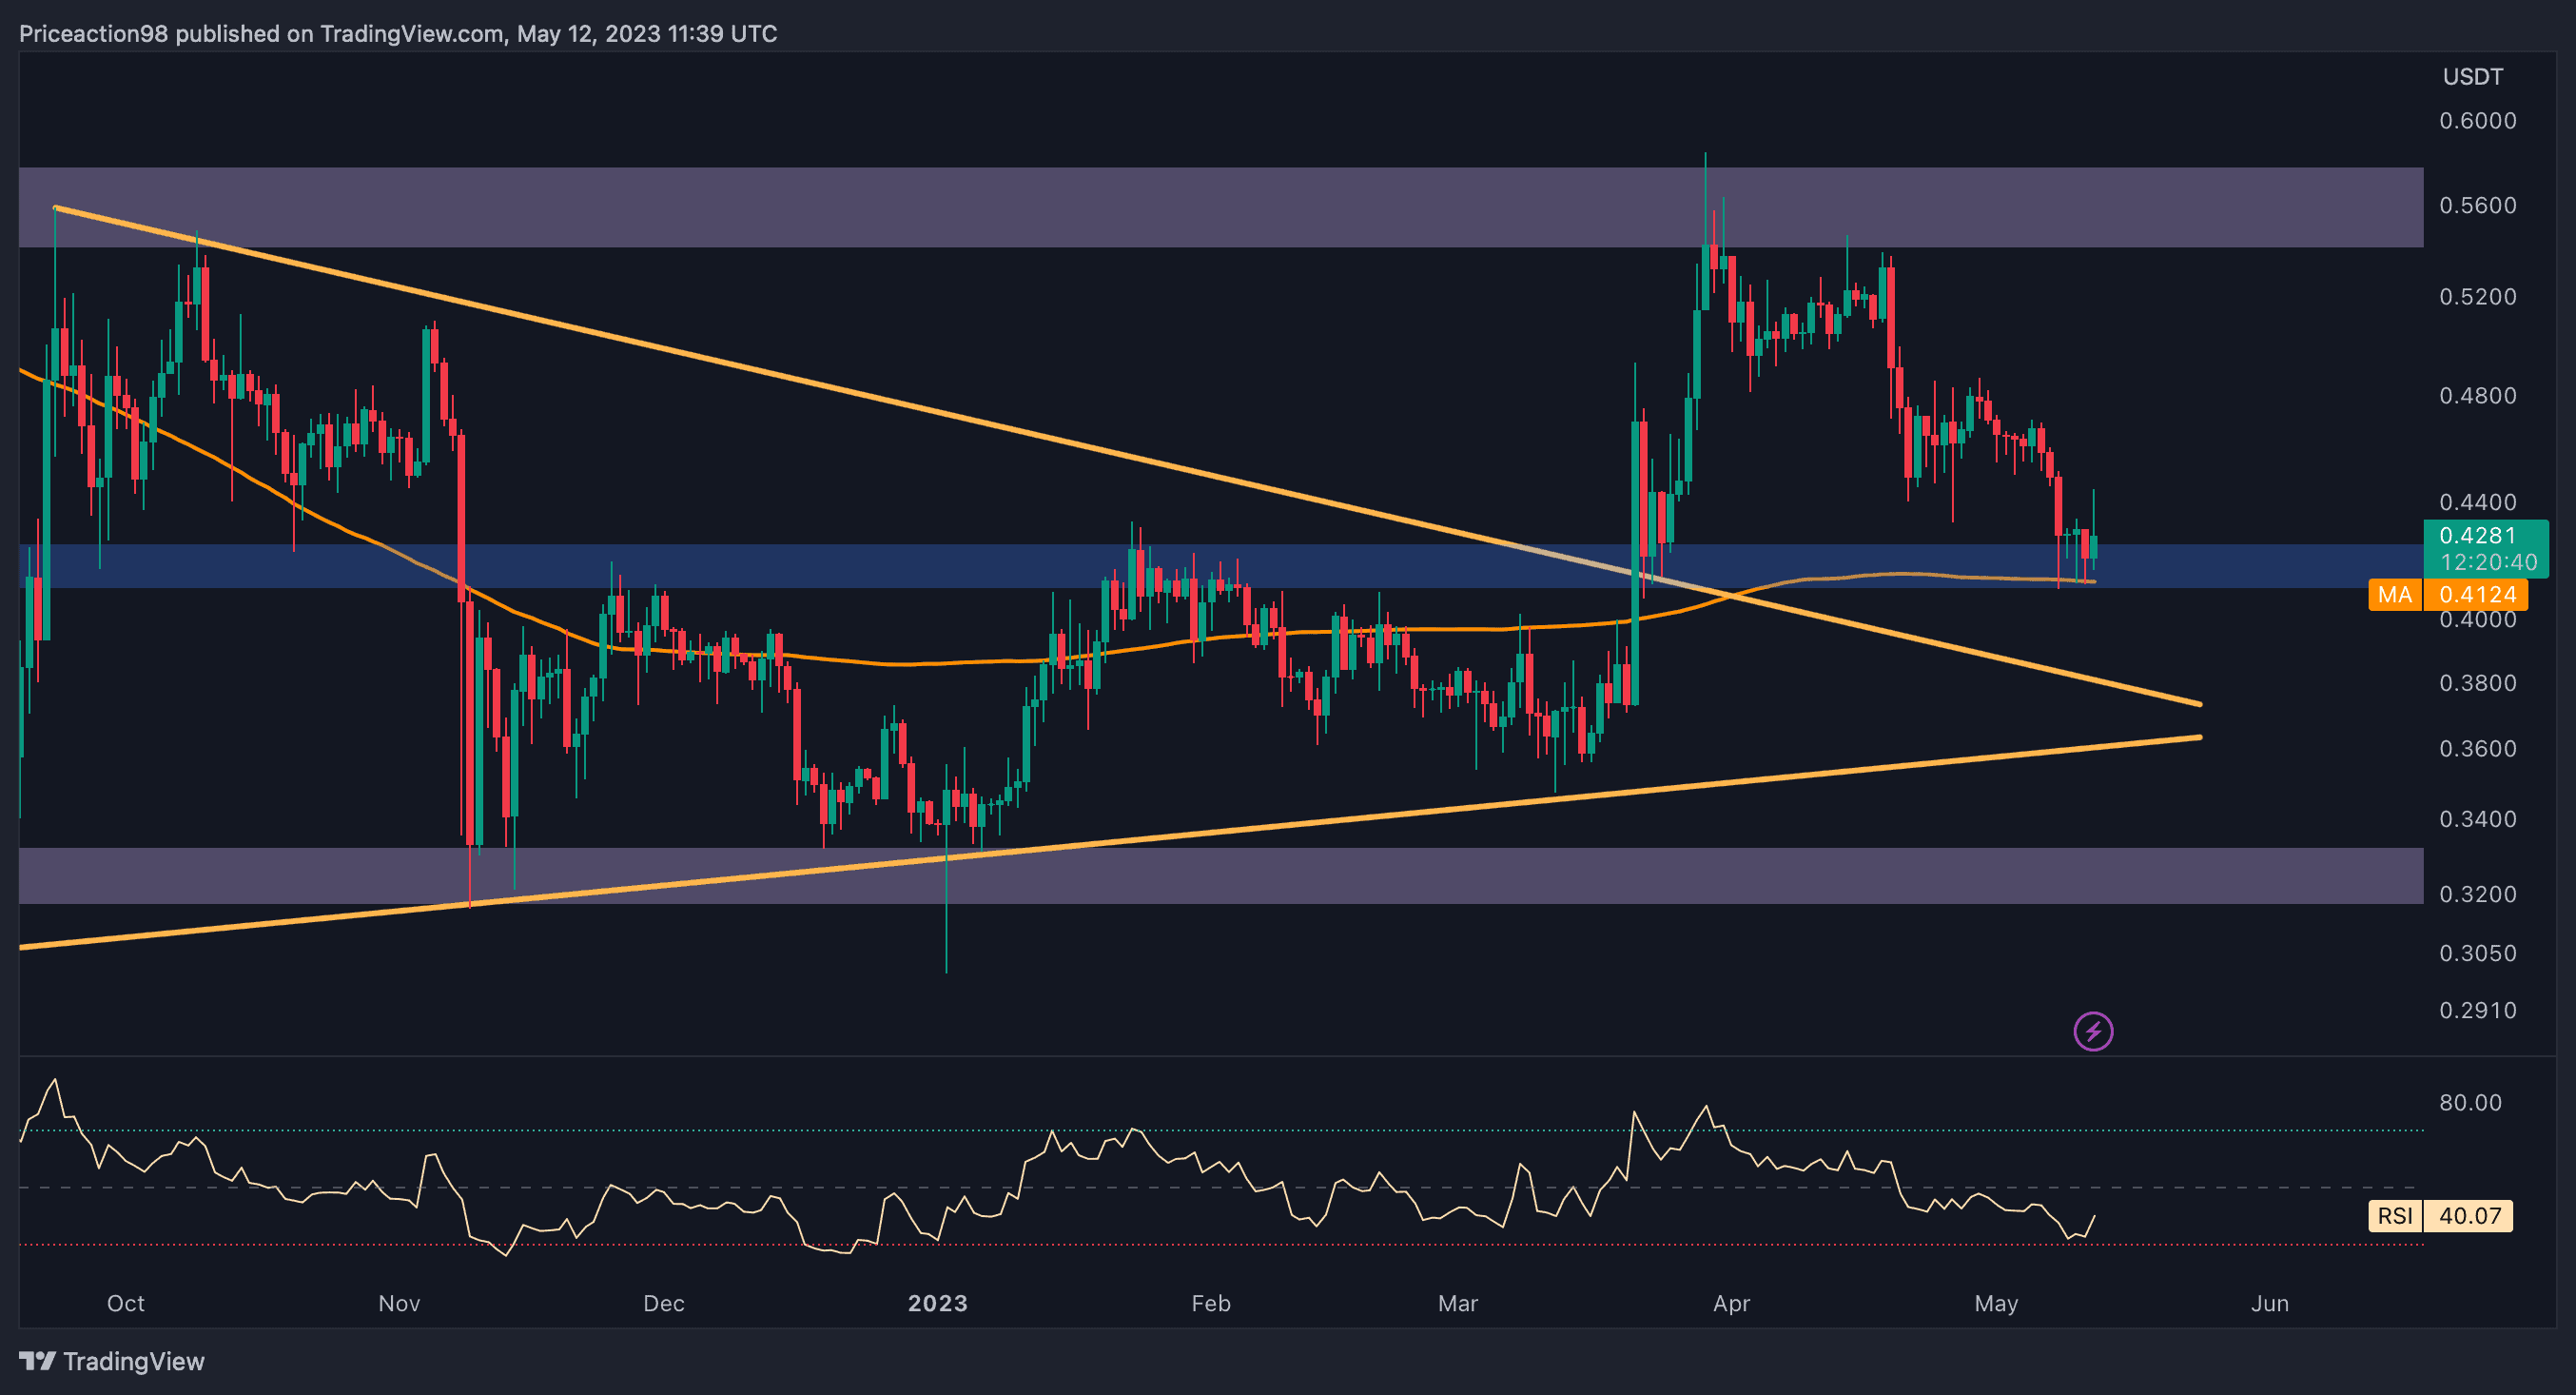
Ripple’s current price is in a precarious position as it approaches a crucial support region consisting of the 200-day moving average and the $0.41 price zone. If the price falls below this critical level, it could potentially trigger a significant downturn toward the descending trendline.
Looking at the daily chart, it is evident that after several weeks of rejection, Ripple’s price has arrived at a strong support area at the 200-day moving average of $0.41. This moving average is a powerful indicator, and XRP may enter a consolidation phase if it holds above this level. However, failure to maintain support at this zone could lead to a bearish sentiment over the market.
On the other hand, if Ripple finds support at the 200-day moving average, buyers can hope for a mid-term uptrend toward the $0.56 resistance level.
Ascending Channel on 4-Hour Chart
Examining the 4-hour chart, Ripple’s price has formed an ascending channel, but recent rejection caused it to drop below the minor support level of $0.48 and the channel’s mid-trend line. Currently, the price faces a crucial support level at $0.41.
In summary, market analysis is supportive of a potential consolidation stage around the mentioned support area until a breakout occurs. It is important to observe how the price will react, as this will likely provide insight into the short-term trend. The support area’s significance cannot be ignored, and a breach below it could trigger significant market movement.