
Bitcoin, the flagship cryptocurrency, has made headlines recently due to a noticeable bullish reversal from an important support region defined by the Fibonacci retracement levels of 0.5 and 0.618. As the price climbs towards the significant 100-day moving average positioned at approximately $61.6K, traders are left to ponder the sustainability of this movement and the potential selling pressures that might arise at this level. This article delves into the recent changes in Bitcoin’s price action and the implications for current and prospective investors.
Technical Analysis: Support and Resistance Dynamics
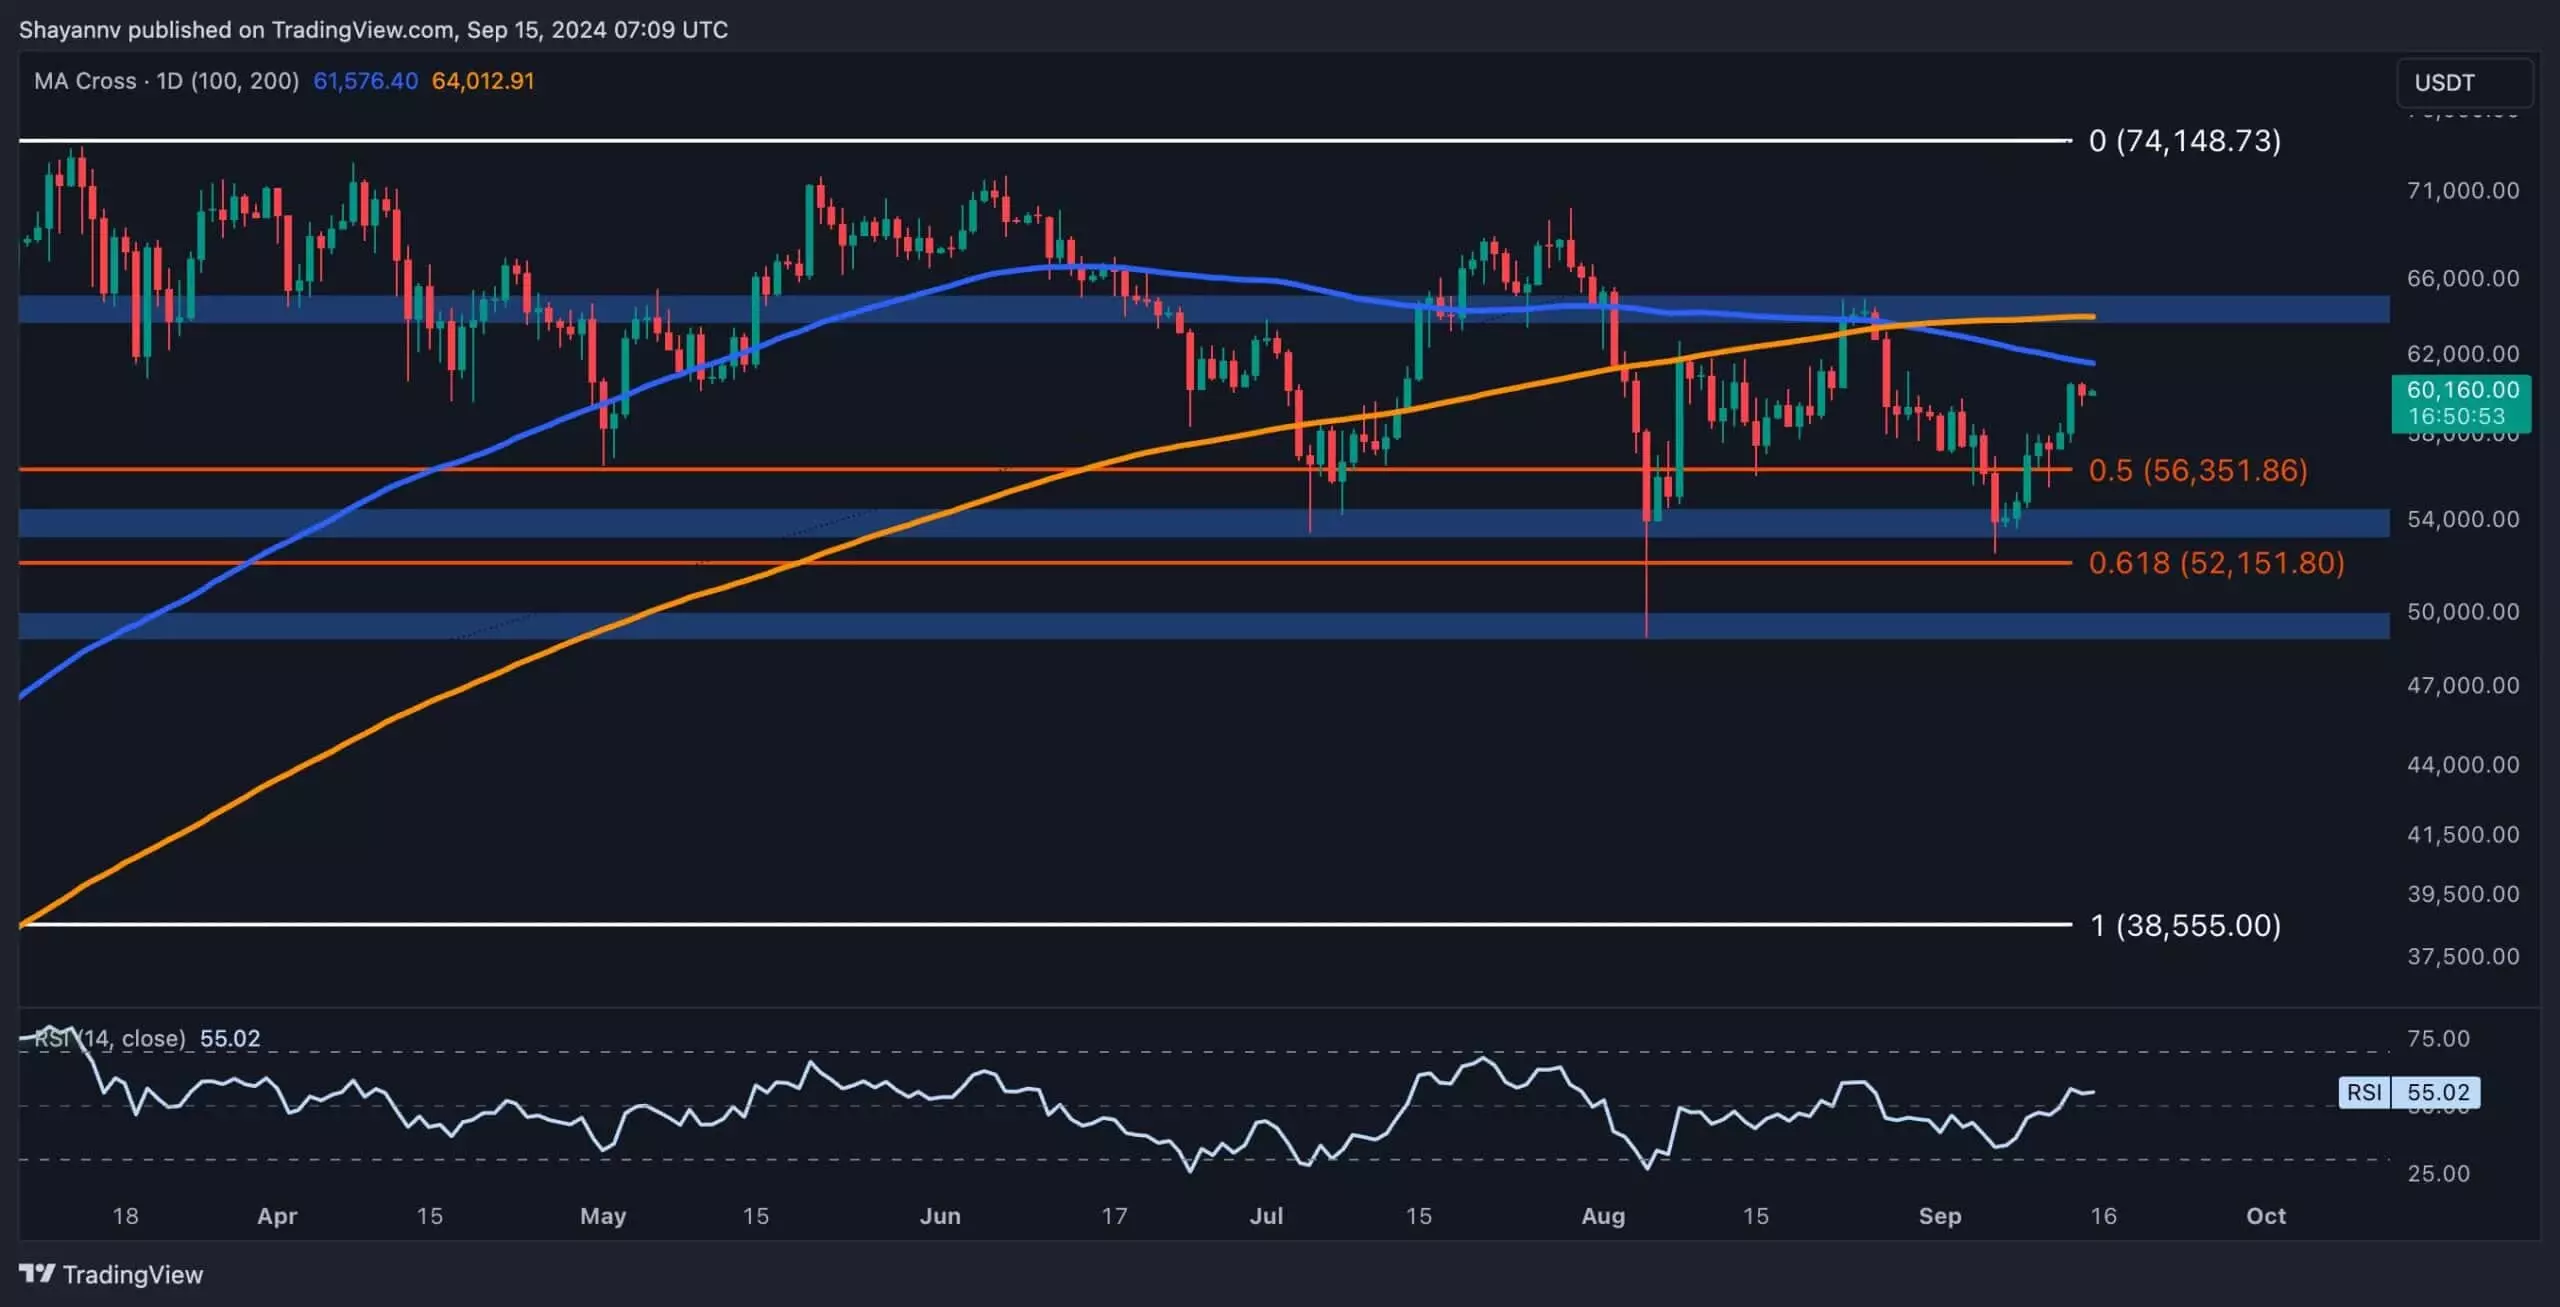
Upon analyzing Bitcoin’s daily chart, one can see a remarkable turnaround following a previous decline that reached the critical support zone between $56.3K (0.5 retracement) and $52.1K (0.618 retracement). The asset found robust buying interest in this zone, resulting in a substantial reversal that pushed the price up by roughly 15%. This bullish progression, however, brings BTC face to face with the 100-day moving average, a notorious resistance that could invite significant selling pressure.
Current price behavior illustrates that buyers have returned, seeking further upward momentum. However, Bitcoin’s trading range narrows, caught between the formidable resistance at $61.6K and the support between the 0.5 and 0.618 Fibonacci levels. This scenario hints at a possible period of consolidation where volatility may diminish as traders reassess their positions.
Zooming into the 4-hour chart, Bitcoin showed a clear reversal near the $53K support, which aligns with the 0.618 Fibonacci level. This price action incited a bullish trend, effectively halting what appeared to be an imminent bearish momentum. The inability to establish new lower lows in the $52K-$54K range indicates persistent buying interest, contributing to the optimism surrounding the cryptocurrency.
However, as Bitcoin approaches the $65K region—historically challenging territory for the asset—it stands at a critical juncture. Should buyers successfully break through this zone, the next goal in sight would be the psychological barrier of $70K. Conversely, a failure at $65K could trigger a bearish reaction, potentially pushing the price back toward the $52K-$54K support, marking a crucial test for the bulls.
To bolster the technical analysis, it is vital to consider market sentiment through indicators like the Market Value to Realized Value (MVRV) ratio. This metric provides insights into the overall health of the market by dividing the market capitalization by the realized capitalization. A ratio deteriorating below 1 often indicates that investors are facing losses collectively, marking a common characteristic of bear market bottoms over extended periods.
Recently, Bitcoin’s MVRV ratio fell below its 365-day moving average—a landmark historically associated with market recoveries. Although this development could signal a potential opportunity for long-term investors, caution is warranted. A genuine recovery is usually confirmed when the MVRV ratio climbs back above this critical threshold. Historical trends suggest that such movements typically reignite investor confidence, yet the prevailing atmosphere of anxiety and uncertainty may delay any significant rebound.
Conclusion: A Crossroad for Bitcoin Investors
Bitcoin’s recent bullish reversal highlights the intricate dance between support and resistance levels amidst fluctuating market sentiment. As the cryptocurrency approaches significant barriers and demonstrates technical signals of buying interest, investors are presented with both potential opportunities and risks. The overall market dynamics remain precarious, with caution advised as Bitcoin attempts to solidify its bullish trend. For both short-term traders and long-term holders, understanding these technical aspects and market indicators may prove crucial in navigating this evolving landscape. Being patient and vigilant in response to market signals will be imperative as Bitcoin endeavors to redefine its trajectory.