
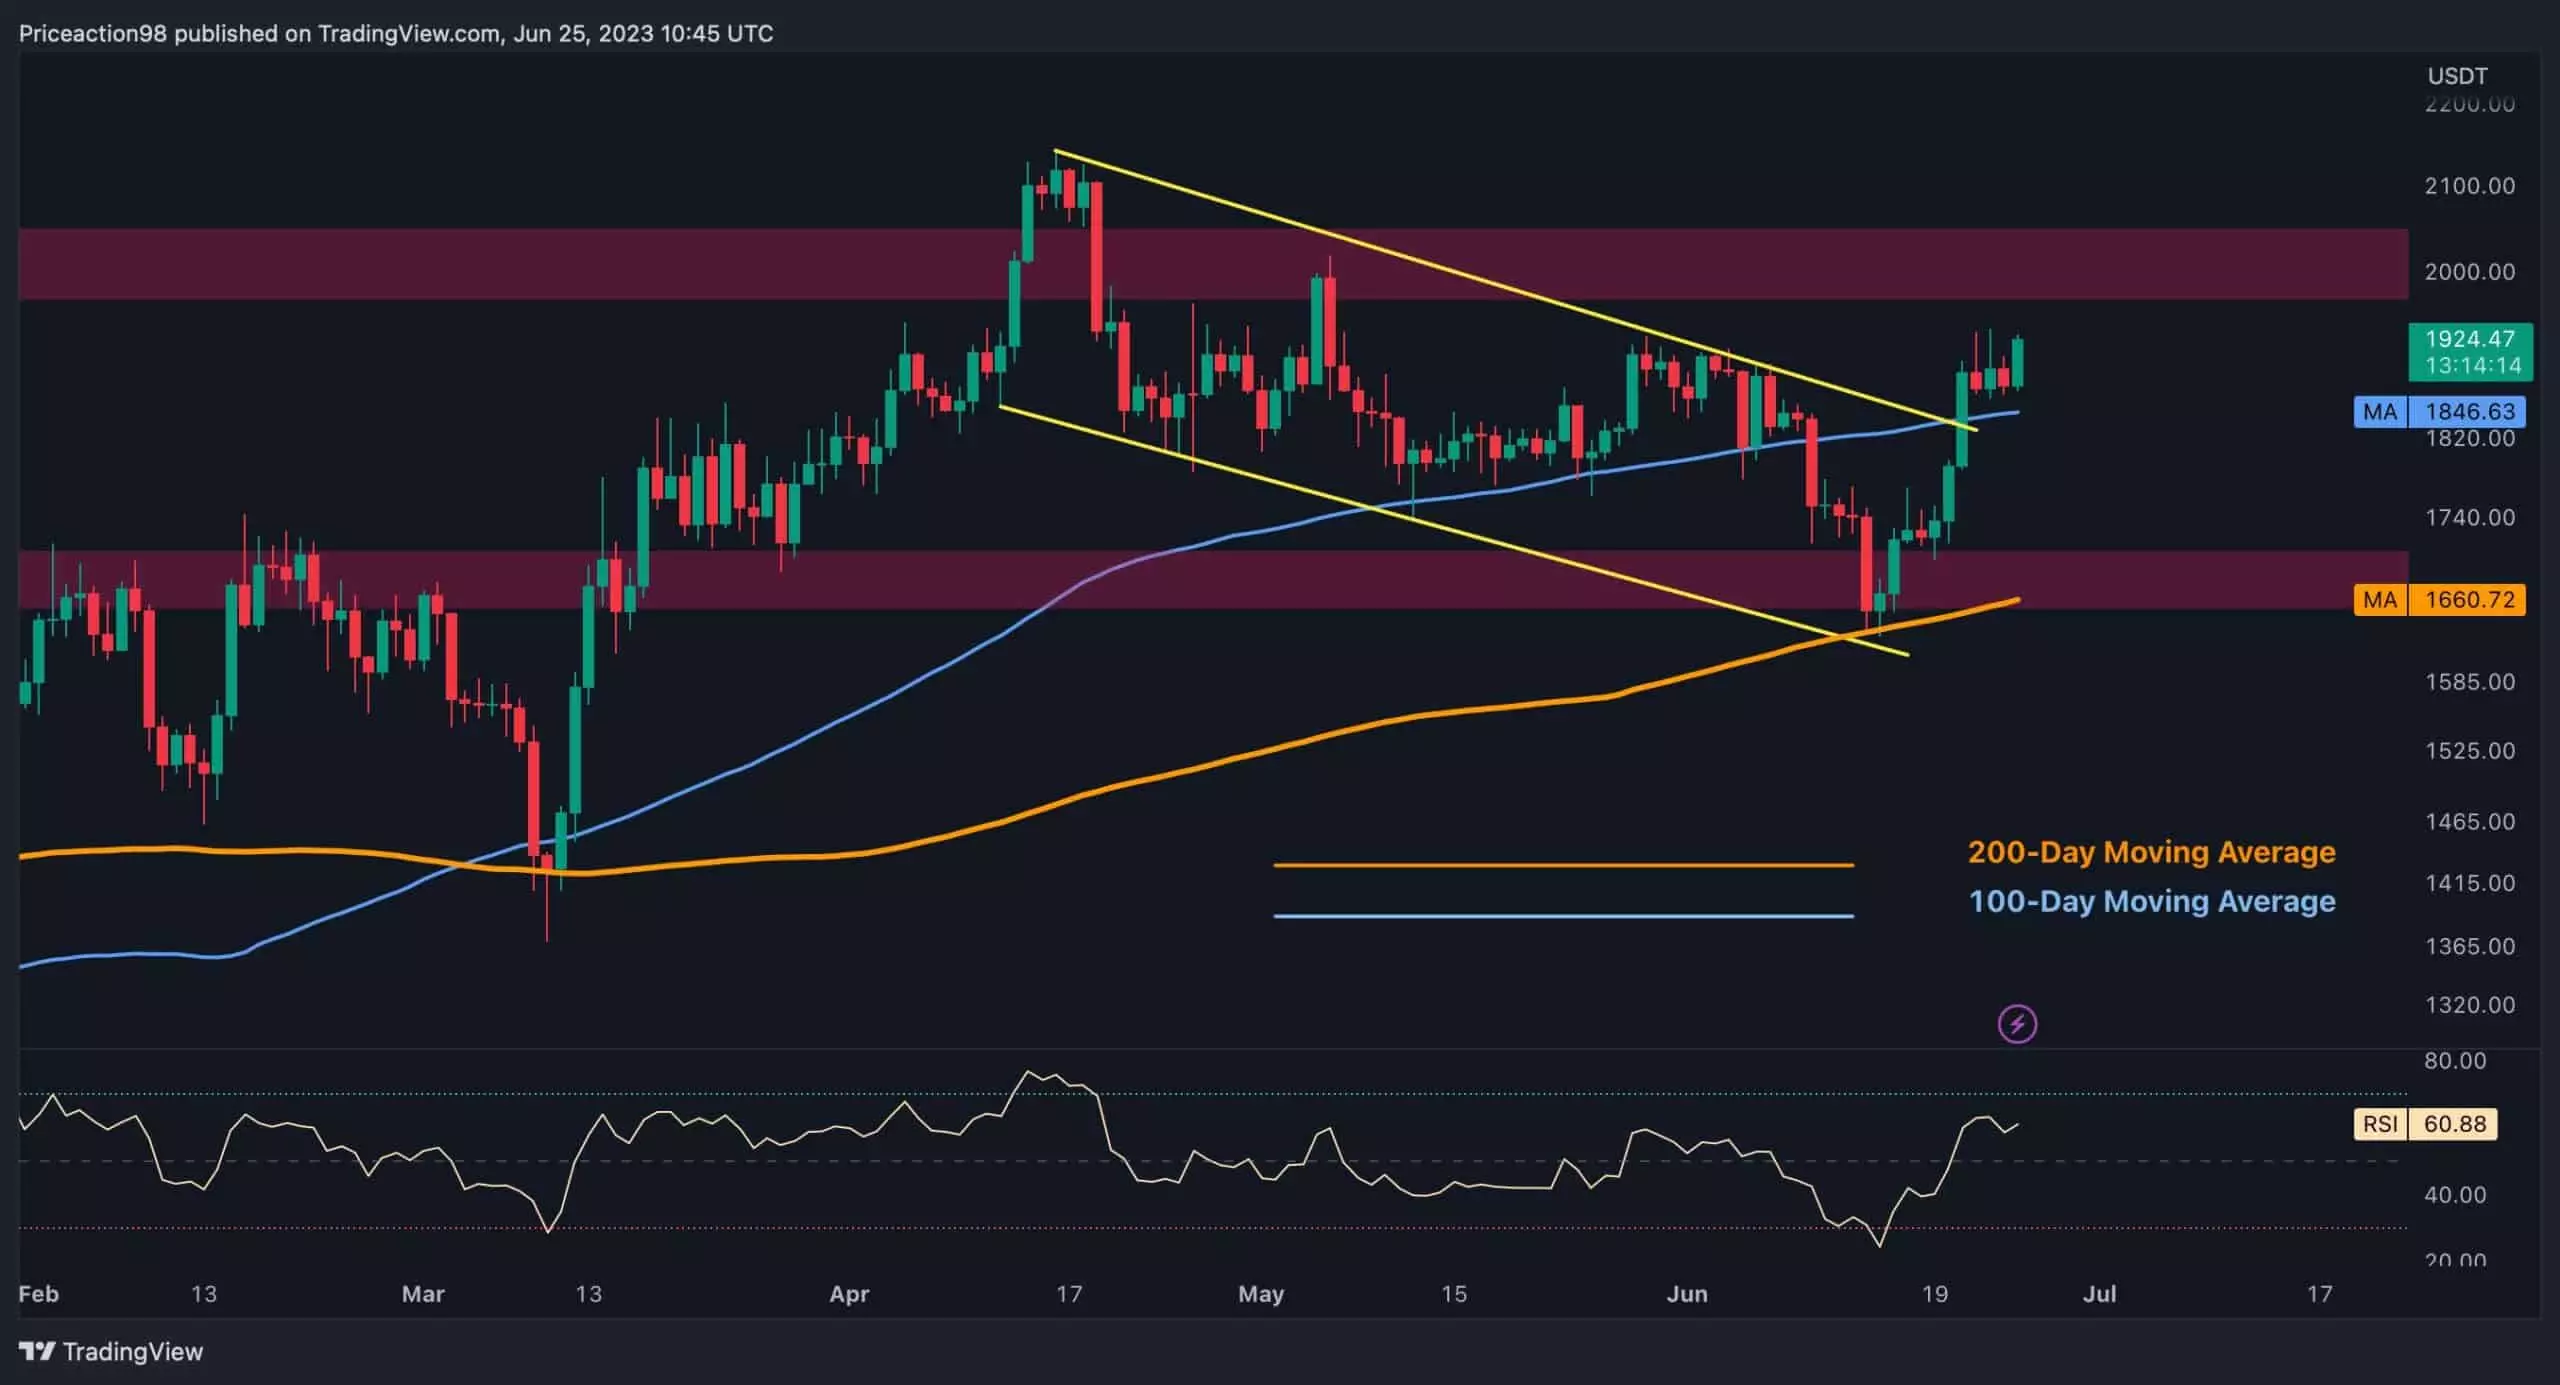
After experiencing a significant downtrend and period of correction, Ethereum’s price found support at the $1.6K level, coinciding with the 200-day moving average. The buying pressure at this level triggered a rapid reversal and an upward trend towards the critical resistance zone at $2K. Additionally, the price surpassed the 100-day moving average at $1.8K, indicating a potentially bullish mid-term outlook for Ethereum.
Fibonacci Retracement Tool Identifies Potential Reversal Points
Although Ethereum’s price experienced a mid-term correction phase, it found support and reversed at the 61.8% retracement level, a commonly observed target for correction phases. This resulted in a robust bullish trend towards the $2K region. However, the bearish divergence between the price and the RSI indicator suggests the possibility of slight rejection and short-term consolidation before Ethereum makes its next move.
Consolidation Below $2K Reflects Uncertainty in Futures Market Sentiment
Ethereum has been consolidating below the $2K level for the past few months after being rejected from that level. The uncertainty seen on the price chart is also reflected in the futures market sentiment, measured by the Funding Rates metric. After a period of correction in the market, the price found support and began a strong rally. However, the metric has started to show a slight uptrend during this bullish rally, suggesting increased buying pressure and a greater tendency among participants to take long positions rather than short positions.
Exercise Caution to Avoid Bull Trap
Although the recent bullish rally could be a positive indicator for Ethereum’s mid-term prospects, traders should exercise caution as it may actually be a bull trap, potentially leading to a long-squeeze event. To confirm the presence of a bull market in 2023 and restore sufficient demand to the market, Ethereum’s price still needs to overcome substantial resistance at the $2K region and consolidate above it.
Ethereum’s recent price movement and potential for a bull market in 2023 are influenced by various factors, including support at the 200-day moving average, Fibonacci retracement levels, and futures market sentiment. While there is potential for a mid-term bullish trend, traders should be cautious and monitor Ethereum’s ability to overcome substantial resistance at the $2K region.