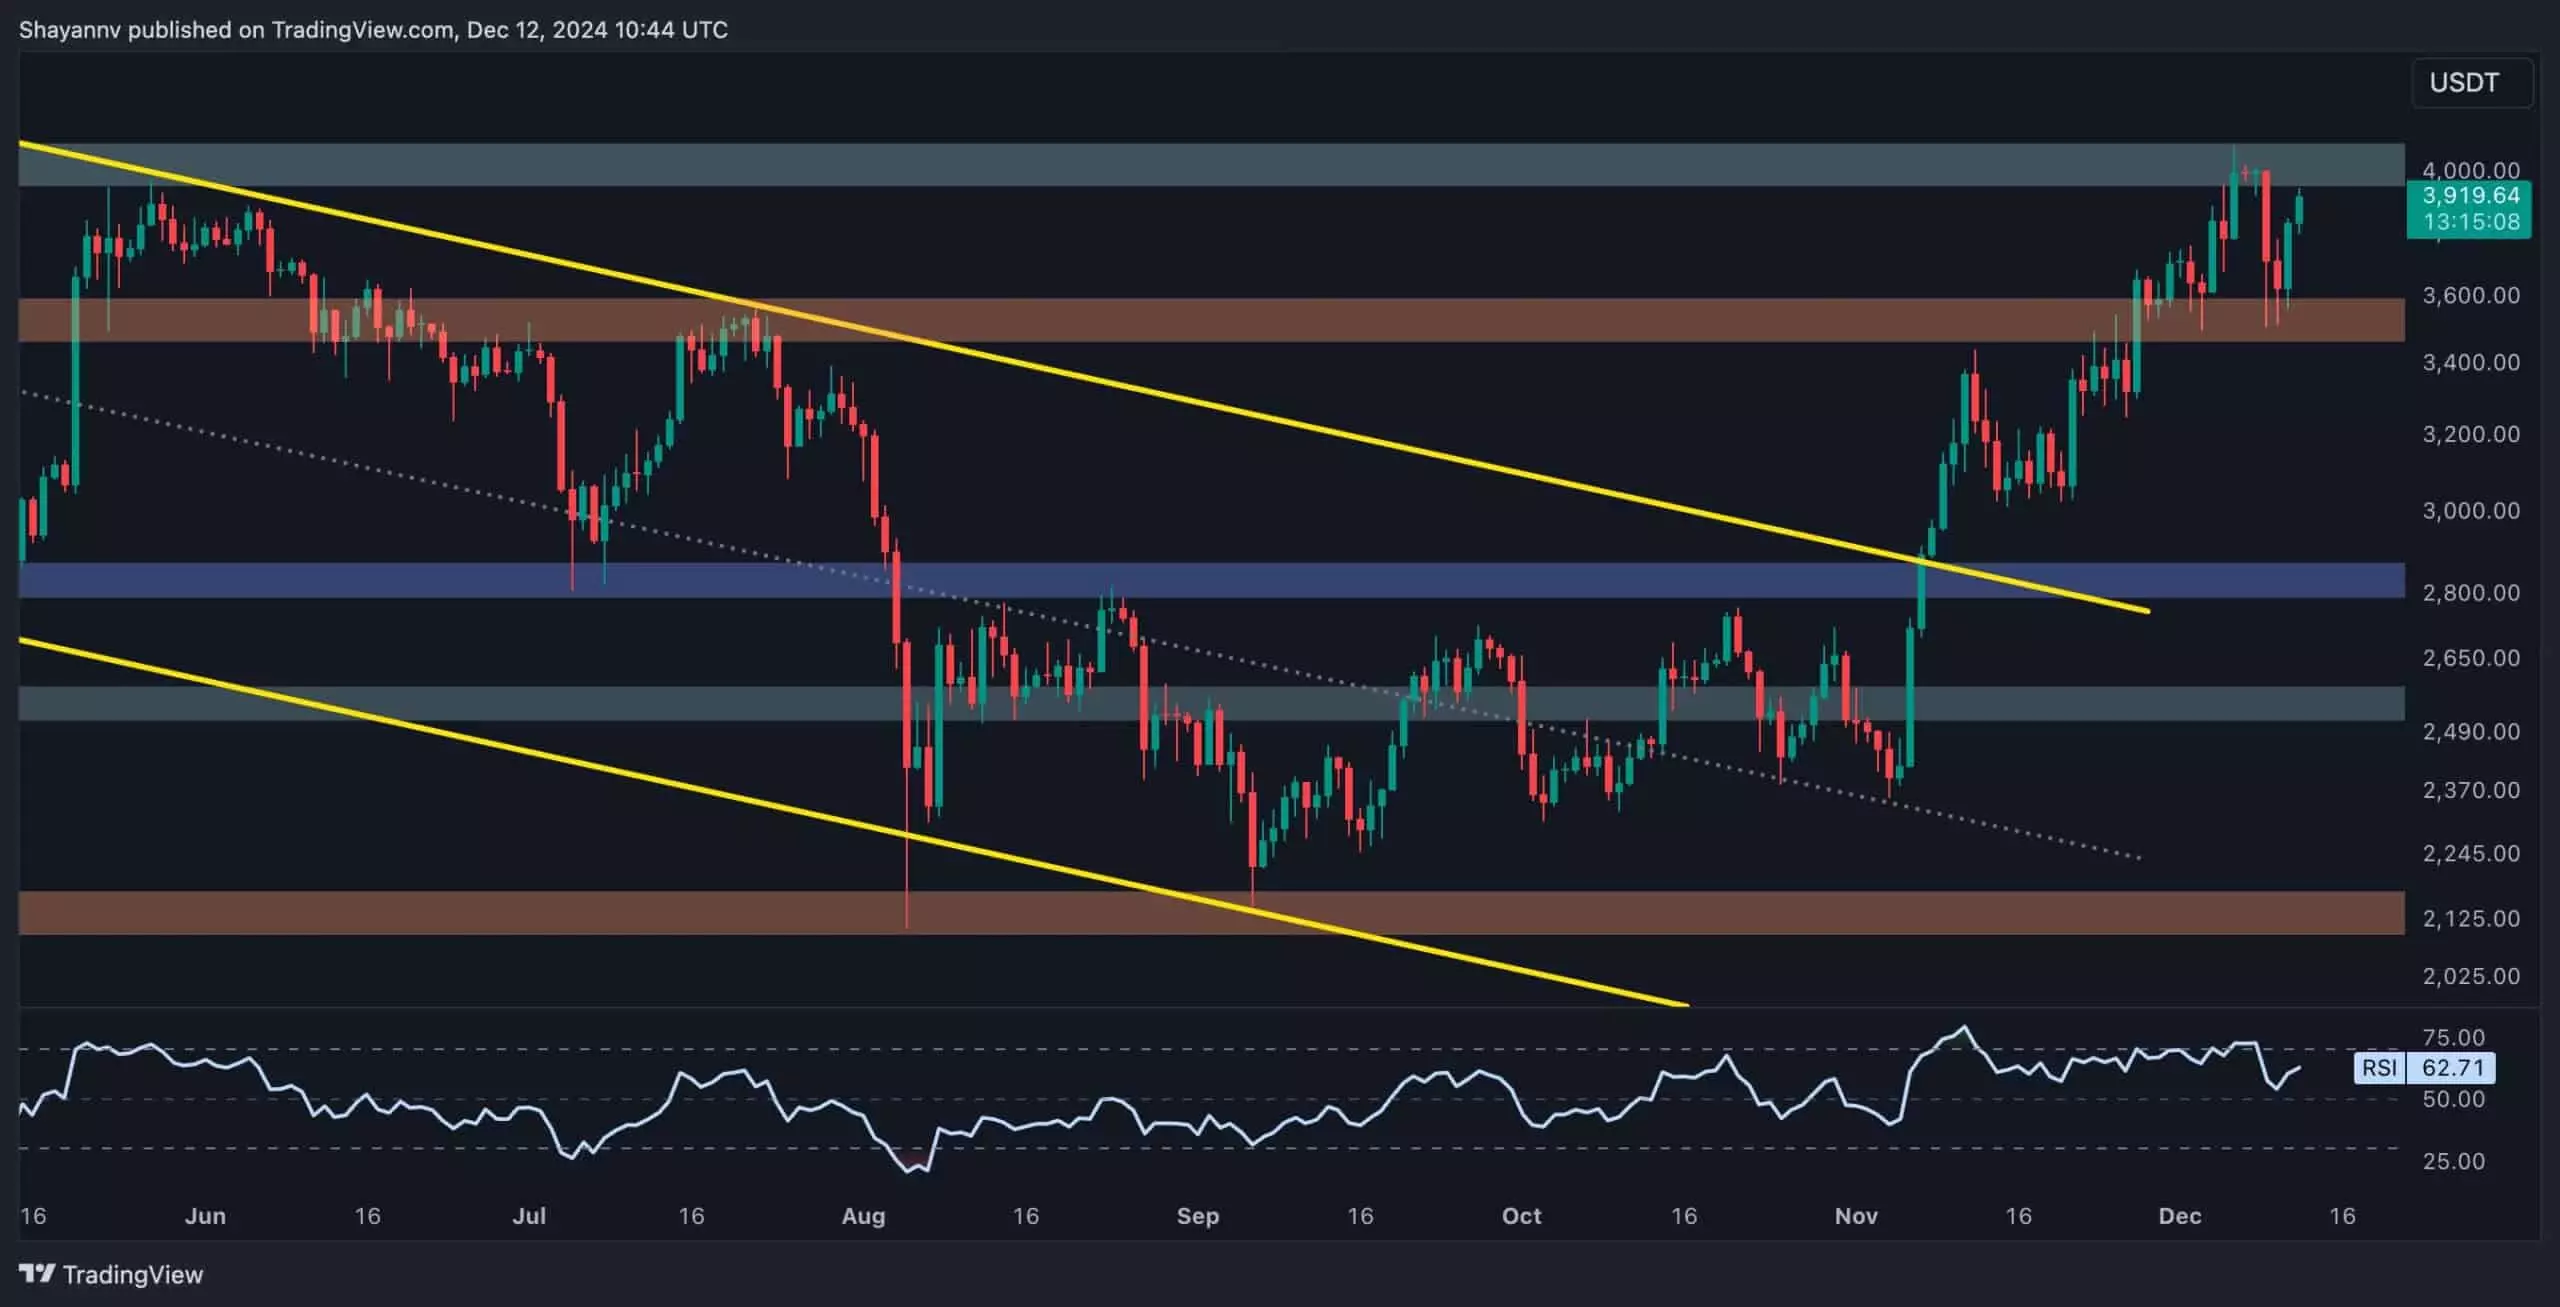
Ethereum has been experiencing fluctuations within the significant trading range of $3,500 to $4,000. This dynamic price behavior indicates the ongoing battle between buyers and sellers within this critical zone. Recently, Ethereum established a support level near the lower boundary of $3,500, where the bulls have shown notable resilience. This rebound in price suggests that buyers are eager to take advantage of lower prices while strategically pushing toward the upper resistance at $4,000.
The price action around the $4,000 mark has elicited a strong response from sellers. As Ethereum approaches this level, it encounters a high volume of sell orders that have historically curtailed previous upward movements. The consistent rejections at this resistance emphasize its importance as a psychological barrier, and traders closely monitor this area for potential breakout signals.
Assessing Current Trading Patterns
Upon reaching the $4,000 resistance, Ethereum’s upward momentum faced significant resistance, leading to a swift decline back toward the lower part of the trading range. This retreat highlights the robust selling pressure present at this resistance level, causing a large number of traders to liquidate their positions. Such price behavior emphasizes the dominant role that both support and resistance levels play in shaping market sentiment and trading strategies.
Despite this setback, the observed rebound near the $3,500 mark, spurred by increased buying pressure, suggests that market participants remain optimistic about Ethereum’s short-term prospects. The resurgence has brought Ethereum’s price back toward the critical $4,000 zone, reaffirming the importance of the established trading range. However, the lingering bearish divergence on the Relative Strength Index (RSI) calls for cautious optimism. This technical indicator serves as a warning sign that the buying momentum might be waning, suggesting that a brief period of consolidation could be on the horizon.
The Liquidity Landscape and Potential Implications
A deeper analysis into Ethereum’s price dynamics reveals key liquidity concentrations around the $3,500 and $4,000 thresholds. The liquidity heatmap indicates significant orders resting below $3,500, while a hefty concentration of short positions aligns with the $4,000 resistance. These areas of accumulated liquidity are crucial as they illustrate where market participants are likely to act, whether through entering new positions or closing existing ones.
Should Ethereum manage to breach the $4,000 resistance decisively, it could trigger a cascading effect of short liquidations, driving the price higher as short-sellers scramble to close their positions. This escalation in buying pressure could ignite a strong bullish rally, potentially leading to a much broader upward trajectory.
Conversely, a failure to break through the resistance with sustained momentum could lead to substantial price declines, as traders quickly respond to the heightened volatility and potential liquidations in the market. In essence, the upcoming price action will be crucial for determining which direction Ethereum ultimately takes.
Ethereum’s current trading environment within the $3,500 to $4,000 range highlights the intricate interplay of market sentiment, liquidity dynamics, and resistance levels. Traders and investors are keenly attuned to the potential for a breakout or breakdown as Ethereum continues to navigate these pivotal price points. The market’s response to the upcoming days will determine whether the cryptocurrency will solidify its upward trend or reassess its strategy in the face of mounting selling pressure.

