
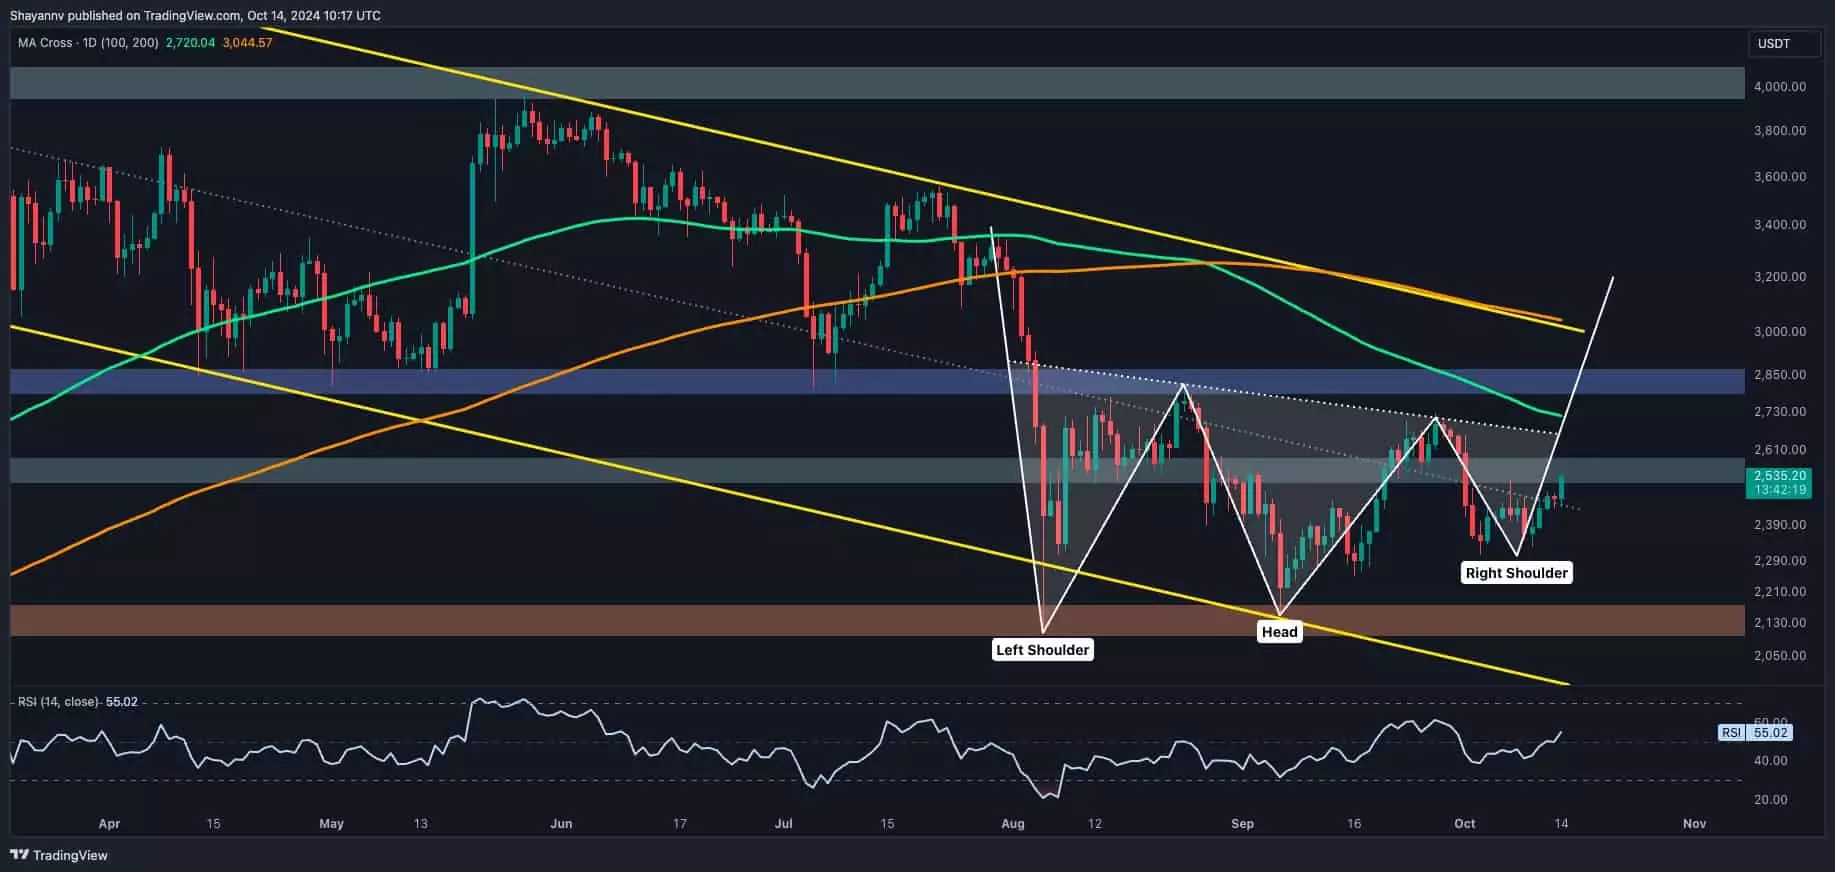
Ethereum is navigating through a pivotal juncture as powerful technical patterns emerge on its price charts, suggesting the potential for divergent market movements. Currently, the cryptocurrency finds itself demonstrating both resilience and vulnerability as it consolidates around critical support and resistance zones. The formation of an inverted head-and-shoulders pattern on the daily chart, coupled with a double-bottom signal on the 4-hour chart, lays the groundwork for asserting either a bullish resurgence or the continuation of bearish trends.
This period of indecision indicates a broader market tension, where buyers and sellers are struggling to dominate the narrative. With Ethereum’s price maintaining itself close to the $2.1K support level, market sentiment is cautiously optimistic. Traders and analysts are closely monitoring the neckline at $2.7K. The importance of these levels cannot be overstated, as breaking through could catalyze a shift in momentum, whereas failure to sustain those levels might usher in a new wave of selling pressure.
Typically regarded as a bullish reversal formation, the inverted head-and-shoulders pattern outlines a classic scenario for a market rebound. With Ethereum finding robust support around the $2.1K mark, it hints that buyers are ready to regroup and potentially mount a rally. The formation’s neckline at $2.7K behaves as a litmus test; breaching this barrier could herald a broader recovery phase, putting targets of around $3K on the radar for optimistic investors.
The ongoing consolidation defines a triangle of potential outcomes. Should Ethereum ascend past the neckline, the technical indicators suggest that traders could recalibrate their strategies to capitalize on upward momentum, potentially opening doors to uncharted territories in the price spectrum. Conversely, if the price falters beneath the established support level, the implications could be troubling, pushing traders to revisit their positions and reconsider their market forecasts.
Zooming into the 4-hour chart, intriguing dynamics are at play. The double-bottom pattern signifies a flicker of optimism amid the prevailing uncertainty. This technical formation presents a compelling case for a rebound in the near term, provided Ethereum can energize its momentum. Notably, the price has been hovering within an ascending flag pattern, creating a dynamic resistance around the $2.6K and $2.8K Fibonacci levels. These levels should be watched diligently, as they are likely to provide critical guidance in the near-term strategy for traders.
The oscillation between these price points serves to heighten volatility, with the potential for significant moves on either side. Should Ethereum break through the 0.618 Fibonacci level, it could pave the way for renewed optimism, influencing bullish traders to flood back into the market. However, the vulnerability lies heavily on the descending boundary of the upward flag; violating the $2.3K mark may prompt a rapid selloff, leading to a confrontation with the $2.1K support level.
Delving deeper into market mechanics, an analysis of liquidity zones reveals a complex interplay shaping Ethereum’s price trajectory. The Binance liquidation heatmap activates a broader perspective, signifying areas of substantial stop-loss orders that major market players – often termed “whales” – have strategically placed. The $2K region illustrates heavily concentrated liquidity, which establishes a formidable defensive stance against downward movements.
This institutional engagement creates an intricate balance, as buyers perceive the $2.8K resistance zone as a significant hurdle due to existing liquidity concentrations. Thus, the stakes are critically high: any directional breakout could unleash a chain reaction through rapid liquidations, potentially amplifying price volatility in the direction of the breakout. In such a nuanced market environment, traders are left to anxiously await this inevitable pivot point.
Ethereum stands at a crossroads where a plethora of indicators hint at imminent change. The nuanced interplay between support and resistance levels, alongside the recent pattern formations, suggests that the coming days may be determinant in establishing the medium-term fate of the cryptocurrency. Whether Ethereum’s next move will be one of bullish resurgence or bearish retreat remains to be seen; either way, traders need to remain vigilant, ready to act as the tide of market sentiment shifts. The landscape is ripe with opportunity and risk, making it an exciting time for Ethereum enthusiasts to engage critically with their trading strategies.