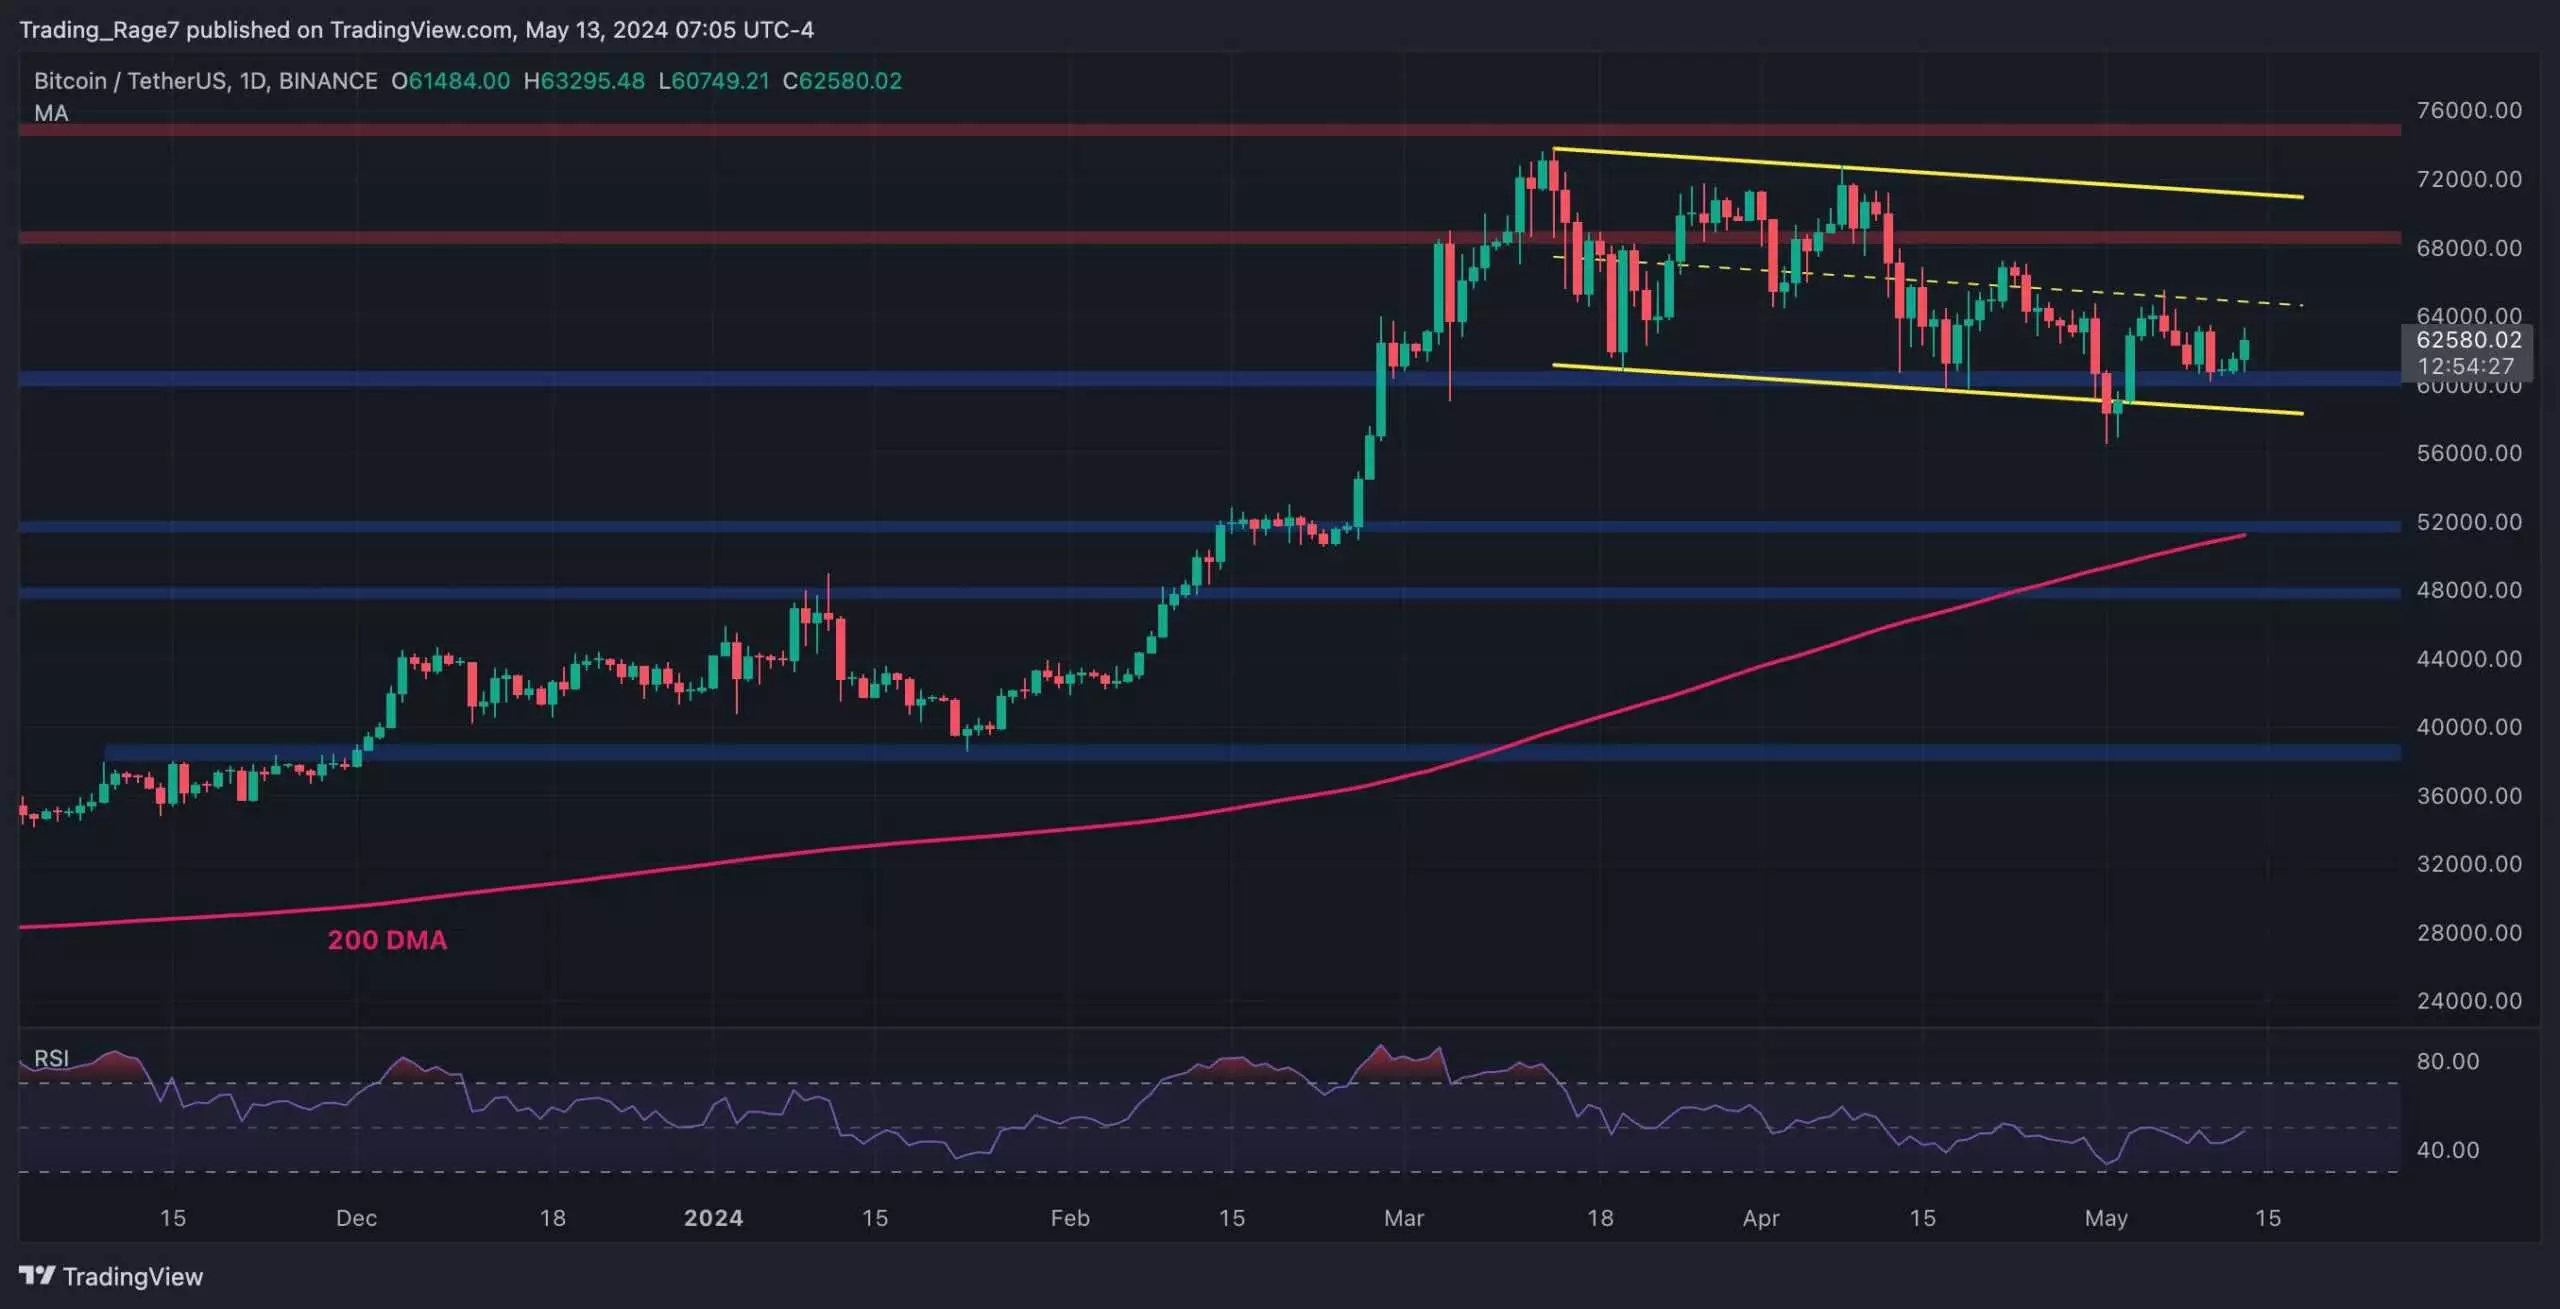
Bitcoin’s price has been facing challenges in maintaining its upward momentum ever since it dropped from the $75K level. However, despite the appearance of a bearish reversal and downtrend on the daily chart, there are indications that a new bullish wave might be on the horizon. The price has been consolidating within a large descending channel pattern, forming lower highs and lows. Despite this, the $60K support zone has proven to be strong, holding the price on several occasions. The market seems to be aiming for the upper boundary of the channel, signaling a potential breakout. A move above the channel could signal the beginning of a new bullish trend, while a drop below it could lead to a sharp decline towards the $52K support level.
Short-term Outlook
On the 4-hour chart, the price has recently bounced from the $60K support zone and is currently testing a short-term resistance level around $63,500. The Relative Strength Index (RSI) has crossed above the 50% mark, pointing towards a bullish momentum. If the $63,500 level is breached, the price could rally towards and even surpass the midline of the channel. This scenario could potentially set the stage for a price rally towards new all-time highs.
Market Analysis
While Bitcoin has been undergoing a correction in recent months, the reasons behind the decline are complex and multi-faceted. One factor to consider is the behavior of the US market, as indicated by the Coinbase premium gap. This metric measures the difference between Coinbase’s BTC/USD pair and the BTC/USDT pair on Binance, providing insights into the demand and supply dynamics between the US market and other countries. The Coinbase premium gap has been volatile, particularly on the downside, indicating low values. This suggests that selling pressure from US investors, who are often wealthy individuals and institutions, has contributed to the downward pressure on the price. As long as this trend persists, the prospects for a bullish continuation remain uncertain.
While Bitcoin’s price has experienced setbacks in recent times, there are signs of a potential bullish momentum building up. Chart analysis suggests the possibility of a breakout from the descending channel pattern, with short-term indicators pointing towards a bullish bias. However, the market dynamics, particularly the behavior of US investors, could play a crucial role in determining the future direction of Bitcoin’s price. Investors should closely monitor these developments to anticipate potential opportunities and risks in the cryptocurrency market.

